Mar 15, 2010

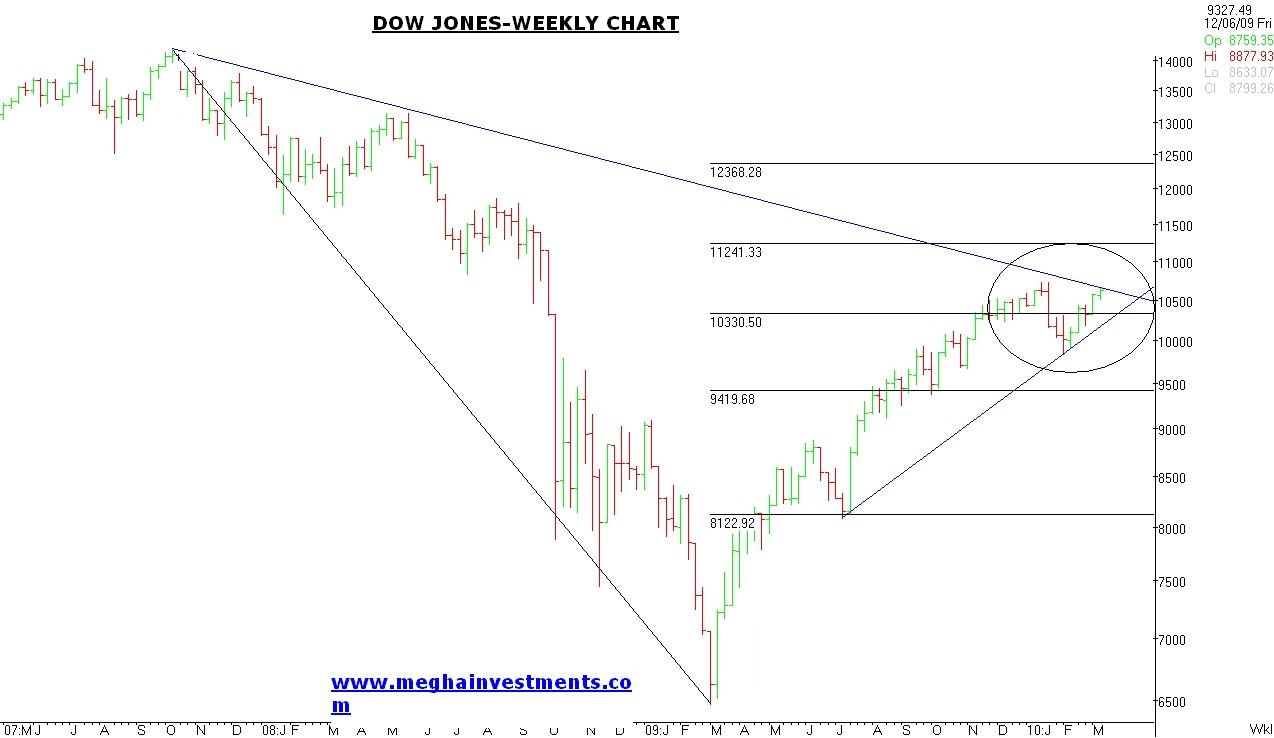
DOW JONES at crucial levels

Dow Jones is trading at resistance levels on two different theory,
(1)Elliott wave super cycle
(2)gann 2700 degree 


Before few month ago i have given analysis with graph (kindly find out from US market key word). Dow  Jones has completed wave 1, around 10500 to 11100 levels to complete wave 2 and thereafter wave 3 to start, which can take dow at new low!

Now as per gann  degree charting, it is at crucial resistance levels of 2700 degree from low of 6469,the resistance levels is 10800.


Why the 2700 degree resistance levels is so important one?
if any one is following or knowing the gann charting there is list of degree and factor and based on that one can find out the future trend reversal levels.


If you convert any degree in to single digit by adding figures it will by "9".  Let's see how,

45 degree=4+5=9
90 degree=9+0=9
135 degree=1+3+5=9
180 degree=1+8+0=9
225 degree=2+2+5=9,
and so on, 

then 2700 degree=2+7+0+0=9


So the levels by converting from  degree become important to change the current trend.  


The rules of the game is to be in direction of major trend and get out when the trend has reached the stage where almost everyone has become complacent and careless.

Posted on Monday, March 15, 2010 | Categories:

Mar 14, 2010

WEEKLY MARKET REPORT FOR TRADERS AND INVESTORS

FUNDAMENTAL STOCK VIEW:
TATA MOTORS LTD.
View: Stock seems fully priced.
Recommendation:
Book profits or avoid new investments.

About Company:
Tata Motors is India's largest commercial vehicle manufacturer.
It acquired the CV division of South Korean auto major Daewoo in 2004.
The Company bought ownership of iconic car brands ‘Jaguar’ and ‘Land Rover’ from the Ford Motor Co in 2008.
The Company launched world’s low cost car “nano” in 2009.
The Company has planned a huge capex  of Rs 120 bn  between 2007 and 2012 for capacity expansion, introduction of new projects, product up gradation and enhancing engineering and research capabilities, which will be funded through a mix of internal accruals and debt.
The Co. has good market share in commercial vehicle segment, diesel segments, owner of world two luxury car brands and owner of world’s low cost car.

Let’s look at the fundamental of the company,
Debt to equity ratio is 1.1:1 which not good sign.
Return on net worth 9.9% which is below expectations.
Price to book value 3 times which is much higher for cyclical nature company like auto sector.
Company had paid interest on loan which is above 700 crores while profit after tax is Rs.1000 crores.

Commercial vehicles are cyclical in nature and car demand is largely influenced by per capita income growth over the long term. So we need to Value Company with price to cash flow indicator.
Cash Flow is the cash earned by the company that can be actually distributed to the shareholders
Due to heavy loss in the last year’s quarter the cash flow was negative for the company.
From the low of 125 in 2008 this stock has outperformed all auto major and make high of 845 and currently trading at 20 P/E multiple which is in our opinion not justify for this company.

Many will argue that company has good opportunity in truck business, diesel car business, luxury car segments and small car segments so why one should not remain invested in this company?

Company has large debt in its balance sheet and needs more money for up gradation, R&D, capacity expansion. If demand goes down or raw material prices such as steel rise then margin will be down significantly and will affect the results of the company.
Always remember our favorite investments mantra is avoid investments when margin of safety is low and other better opportunity is available in market like currently telecom sector trading at low price.

MUTUAL FUND PICK
Birla Sun Life Tax Relief '96-invest.
Recommendation:
This fund has always delivered good return to unit holders.
It’s good to have in every ones tax planning.


WEEKLY MARKET OUTLOOK:
Support at 5050/4985/4935
Resistance at 5190/5305/5350

 Last week market trade in narrow range of just 76 points in nifty fu.
Our stop loss was 5150 and nifty could not close above 5150 levels.
If nifty fu closes 2 consecutive day above 5190 then it can rise to 5300 levels.
We at MEGHA INVESTMENTS AND RESEARCH always come up with flip side of the market.
We have given our view based on 4 different theories.
HEAD AND SHOULDERS,
Look at the chart, index is forming major reversal pattern
                         “Head and shoulders”
Left shoulder top is at 5168 and strong bottom of 4531(Dubai fall bottom)
Head top is 5303-strong rebound from Dubai bottom
Now we if fail to cross the high of head which is placed at 5303 and start falling then it may create right shoulders
So the height of the pattern is 800 point (4531-5303)
Confirmation of the pattern will come by two ways,
-nifty fu should not cross 5303 which is head high
-nifty need to break 4600 mark, which is neckline of the pattern
If both happen then we conclude the successful pattern and big correction is possible up to 3900 levels.

GANN WHEEL,
If you are following the w.d.gann charting then around 5150 it is best opportunity to short nifty with stop loss above 5303(above the high of head and shoulders head) with possible correction up to 4750 levels.
Image not for any use.

VOLATILITY INDEX
This index is less referred by retail traders and investors.
In simple and common wording it shows next 30 days volatility of particular index.
But it also shows the “greed and fear” among the investor and traders.
When the VIX trading at low which indicates no one is buying put option –every one is bullish on market.
When VIX is trading at high which indicates no one is buying call options-every one is bearish on market.

Traders and investors can take benefit of the same and can initiate trades against the trend.
In our case nifty fu VIX is trading at lowest levels since inception!
So one can go short against the bullish trend!

TIME SERIES,
From 1980 it has been history that first quarter of the every 2 year gives major turning to market either on up side or down side if we assume sensex has made high of 17790 then this pull back will not substation anymore.

CONCLUSION,
Traders with high risk capacity can sell nifty fu with stop loss of 2 consecutive closes above 5190.

MOMENTUM TRADING CALLS:
Balarmpur chini mills-
Buy above 97 with stop loss of 92 and targets of 103/105/107.

Hindustan Unilever-
Buy above 227 with stop loss of 218 and target 234.

Reliance ind-
Buy above 1055 with stop loss of 1025 and target of 1100.

ALERT- We expect profit booking in m&m fin, ambuja cements, abb, shriram transport, lanco infra and thermax. So avoid long position in above stocks.

NEWS TO WATH FOR THE NEXT WEEK:
On 15 the March two important announcements,
(1)  Advance tax figures.
(2)  Monthly inflation figures
RED ALERT ON VIX AND OPEN INTREST

INDIA VIX TRADING AT ALL TIME LOW OF 19.73
OVER ALL OPEN INTEREST AT 108319CRORES HIGHEST SINCE JANUARY 2008...

TO GET REGULAR UPDATE ON MARKET YOU CAN BECOME A MEMBER.
Posted on Sunday, March 14, 2010 | Categories:

Mar 10, 2010

Contrarian view on market, The Flipside.


HEAD AND SHOULDERS Pattern:
Look at the chart, index seems to be forming major reversal pattern called “Head and shoulders”.

Left shoulder top is at 5168 and strong bottom of 4531(Dubai fall bottom).
Head top is 5303-strong rebound from Dubai bottom.

Now we if fail to cross the high of head which is placed at 5303 and start falling then it may create right shoulders.

So the height of the pattern is 800 point (4531-5303).

Confirmation of the pattern will come by two ways,
1-nifty fu should not cross 5303 which is head high.
2-nifty need to break 4600 mark, which is neckline of the pattern.

If both happen then we conclude the successful pattern and big correction is possible up to 3900 levels.

GANN WHEEL:
If you are following the w.d.gann charting then around 5150 it is best opportunity to short nifty with stop loss above 5303(above the high of head and shoulders head) with possible correction up to 4750 levels


VOLATILITY INDEX: India VIX
This index is less referred by retail traders and investors.
In simple and common wording it shows next 30 days volatility of particular index.
But it also shows the “greed and fear” among the investor and traders.

When the VIX trading at low which indicates no one is buying put option –every one is bullish on market.
When VIX is trading at high which indicates no one is buying call options-every one is bearish on market.
Traders and investors can take benefit of the same and can initiate trades against the trend.
In our case nifty fu VIX is trading at lowest levels since inception!
So one can go short against the bullish trend if wants to take a contrarian trade position.

TIME SERIES
From 1980 it has been history that first quarter of the every 2 year gives major turning to market either on up side or down side. If we assume sensex has made high of 17790 then this pull back will not sustation anymore.

CONCLUSION:
Traders with high risk capacity can sell nifty fu with stop loss of 5310.

You may SUBSCRIBE to ONLY NIFTY FUTURES service to GET CONSTANT UPDATES...Because as you know Technicals and Markets are a number game and Numbers change every Second! Today's buy becomes Tomorrow's Sell and Vice-versa. This is the reality and this is the fact. Don't rely on chances...Come closer to certainty...a bit...every day!
Posted on Wednesday, March 10, 2010 | Categories:

Ban on FDI in Cigarette manufacturing:


         The Government of India is proposing a ban on FDI in Cigarette manufacturing in India. The move will come following request of the Health Ministry to include cigarette in the list of activities that are prohibited for FDI. However the domestic players does not seem to be affected adversely because capex and investment plans are generally not of substantial in nature for this industry. Presently, British American Tobacco, Altria Group and Japan Tobacco have the largest investments in India in this sector.
Amongst listed players we have ITC, GTC, VST Industries, and Godfrey Phillips India Ltd which is a KK Modi group company with foreign collaboration of global tobacco major Phillip Moris.
The percentage share of Tobacco products revenue of ITC has come down from nearly 75% from 2005 to around 50% presently.
According to a 2008 report, ITC controlled around 80% of the cigerattes market in India while the GTC (Golden Tobacco Company), VST Industries and K K Modi Group's Godfrey Phillips controlled respectively around 2%, 4% and 10% of the market share.
One view also surfaces that while ITC is purposefully trying to reduce its revenue share from tobacco products, and now this ban on foreign companies' investments. The existing companies will fare even better with some tobacco-investment-interested money coming through the route of stock markets i.e.FII route, which could come to the existing listed companies such as the ones mentioned above.

Releigh Investment Company Ltd. which is a subsidiary company of British American Tobacco Company holds 23.45% shares as promoters according to BSE data as on today. Now will they think of exiting VST Industries Ltd? Well, then if this ban is going to materialise they would do it today or tomorrow! They will have to be contended with the whatever present capacity is unless and except the new investment or capex plan comes from domestic funding/financing of some kind. But traditionally public and banks are resistant of financing tobacco businesses.

Talking about the GTC or Golden Tobacco Company, any value investor wouldn't understand why anyone would want to buy shares of this company. The revenues and bottom-line has been steadily declining for the last five years, except over 2005-06 to 2006-07 when revenues jumped from close to Rs.178 cr to almost Rs.200 cr. Their none of the brand holds appeal in all India market like other players. Other companies that are controlled by this Dalmia Groups are the times of india fame-Bennett, Coleman company, Dalmia Cements, ElectroSteel Castings Ltd.,Dalmia Cements (bharat) Ltd(which is trading at 240 PE of 12 calculated on 2008-09 EPS of Rs.20., Revathi Equipments Ltd., OCL India Ltd.(We have a buy recommendation at CPM 120, on this Dalmia group cement/refractries/sponge iron company having more than 1100cr topline and trading at a P/E multiple of 5.5 calculated on the basis of average EPS from year2004-05 to 2008-09. 

The proposed ban is directly going to affect the foreign players in  Indian markets. They will have to cut back their further investment plans. They may also have to import from their foreign manufacturing locations which could attract more taxes.

Whatever happens but this ban clearly means less Dollars for this cigerattes manufacturing companies.

Mar 9, 2010

Vascon eng and bharat petro looks hot


buy new listing vascon eng your stop loss 120 will kiss 150/165


buy bharat petro stop loss 527 will kiss 577/580

Mar 8, 2010

Today's Message To paid Members(8 march 2010)

Dull Day for market-open to close down


sell nifty on rise final stop loss 5190,on Friday at 5085 with stop loss 5150 it make high of 5145 and crashed to 5105


now sell reliance ind if breaks 1012 ,it crashed to 1022


sell tata motors at 803 crashed to 793


buy 5000 put at 41/42 ,have patience


what ever we sold we earn profit!

HANG SANG(expanding triangle)


watch chart of hang sang forming "expanding triangle"


be careful at higher levels


it has already broken head and shoulder pattern of  3000 point and pending target is 18600 and below


so be careful at higher levels


DONT JUMP AND BUY
Posted on Monday, March 08, 2010 | Categories:

DOW JONES (head and shoulders)


see the chart dow is possible forming
"head and shoulders" pattern


left shoulder and head(10730) already formed


if not cross high of head 10730 and break below 9800
will confirm 1000 point "head and shoulder" pattern correction.


be careful on higher levels.
Posted on Monday, March 08, 2010 | Categories:

Mar 7, 2010

FTSE-bears ready to attack?

 just see the chart given below on Friday index make double top @ 5600


Friday was the 21 day from the low of 5033


rising wedge from 5033 to 5600 levels


be cautious at higher levels in all European market.


i will update more about dow jones,hang sang soon.


Posted on Sunday, March 07, 2010 | Categories:

Intelligent Idiots

Intelligent Idiots write/speaks/says bla-bla about my levels

I Likes Critics.....

I Always Say..First Try To Achieve Something
If u are in market

try to find out how may analyst around you have the position the stock recommended by them!

i like one quote from "GURU" picture when people near you criticize,you are doing  progress!
Posted on Sunday, March 07, 2010 | Categories:

Mar 6, 2010

WEEKLY MARKET REPORT FOR TRADERS AND INVESTORS

FUNDAMENTAL STOCK VIEW:
HINDALCO INDUSTRIES LTD.
CMP 168.
 Recommendation:
This counter seems to be overvalued and we recommend to book profit and avoid for any fresh investment.

Rational:
Hindalco Industries Limited, the metals flagship company of the Aditya Birla Group, is an industry leader in aluminum and copper.

Hindalco is the world's largest aluminum rolling company and one of the biggest producers of primary aluminum in Asia. Its Copper smelter is the world's largest custom smelter at a single location.

Company’s copper business is essentially a play on the refining margins as the company does not have its own copper mines that cater to 100% of its concentrate requirement.

Since the beginning of 2QFY09, aluminum and copper prices have shown a continuous declining trend. Aluminum prices have fallen by more than 50% to around US$ 1,300 per tonne whereas copper prices are down by more than 60% to around US$ 3,690 per tonne during the last eight months. The LME prices of both the metals aluminum and copper are trading at their multi year lows.  Aluminum prices are trading at almost their six year lows, while copper prices are ruling at their four year lows.

 Many people will argue that Indian and Chinese economy is growing and demand will create price in future but this is about the growth oriented investor and not for conservative investors who follow value buying across the market.

Many people and analyst follow the simple rule of P/E multiple and take decision that some stock are trading cheap or overbought but we at MEGHA INVESTMENTS AND RESEARCH doesn’t follow the one thumb rule while valuing a company or industry.

In 2008 when all was well in global, stock was trading above 200 levels and after the sub prime stock crashed to 30 levels at the same time Indian and Chinese economy was growing and still we both are growing so why the stock was crashed?

Reason is simple stock was trading at high based on high growth story and everyone forget the valuation parameter so we know the growth but the valuation should not be overpriced while investing.

Always remember when the party is going to over all musicians’ play their organs vary fast, one should always stop dancing before music stop.

It is possible that after we exit the stock stock may move higher but one should find out the next big opportunity to invest their money without regrets.

Aluminum and copper, being cyclical sectors, cannot be valued on P/E multiple, given the volatility in earnings. During times of cyclical downturns, non ferrous metal companies tend to get severely affected, as the business is capital intensive in nature and has higher fixed cost and vice versa. So we believe a sound and consistent parameter to value the sector would be on the basis of the Price-to-Book Value.

Theoretically B/V is what the shareholder would receive if the company would ever go into liquidation for a conservative investor

At current market price it is trading at 1.34 times of the book value.

We believe that at this valuation HINDALCO IND is trading over priced and one should book profit.

MUTUAL FUND VIEW:
Principal Dividend Yield Fund
Recommendation: Avoid.
Rational:
This fund fails to deliver impressive returns.


WEEKLY MARKET OUTLOOK:
SUPPORT AT-5060-5000-4985-4900
RESISTANCE AT-5120-5150-5200

Last week argued that Sensex need to fill the gap of 17025 very fast and it happen.
From the budget day both index are trading positively with buying from intuitions.
In the last two trading session nifty is trading between 5050 to 5120 and consolidating at higher levels.
Hourly chart are over bought with rising wedge formation which often creates sudden panic in markets.
On the time series we have complete 4 week from the low of 15650, so we may see minor correction in coming days.

Nifty fu has resistance at 5120/5150 levels one can sell with same stop loss and we expect it can fall to 4950 or even to 4900 levels.


CONTRARIN VIEW ON MARKET:
Look at the chart attached of nifty we have shown “head and shoulder “pattern
Left shoulder and Head is already formed!
Now we need to cross 5300 and 17800 in nifty and sensex to make fail this formation.
Remember crossing above 5300 and 17800 will start wave 3rd as per Elliott wave
If we unable to cross this levels then it may create problem
I will update more in my coming reports so wait till the next up dates.


GLOBAL MARKET ANALYSIS:
S & P 500 USA.
Looks the chart attach 3 consecutive close above 1128 will take to 1160/1175 as per shown “inverted head and shoulders patter”

TECHNICAL STOCK PICKS:
Buy on declines and with stop loss as given for short term delivery based.

Guj hotels.
This co is promoted by ITC group from the last ¾ days some accumulation is going on.
Buy with stop loss of 45 targets are 66/80

Tips ind.

Our street walkers says in the next few days we may see some good news
Buy with stop loss of 55 targets 85/87

First Leasing.
After some good news for non banking finance company from budget for private banks this counter is being accumulated by big corporate house.
Buy with stop loss of 45 targets 75/80

Maxwell.
Street walkers say some buying interest from local punters and they expect good news in coming days.
Buy with stop loss 16 targets 32/40

Container corporation.
Chart indicates some up side.
Buy with stop loss 1150 target 1300

Primal healthcare.
Sell future with stop loss of 427 targets 401/390

Note:
Avoid long position in tata motors,sesa goa,jet air,guj nre coke,moser bare we expect profit booking.


Disclosure: we have vested interest in this report, please read disclaimers and disclosures.

Mar 5, 2010

RDX FOR BULLS (CONTAINER CORPORATION)

Enjoyed GUJ NRE and RELIANCE INFRA or not?

now RDX FOR BULLS-CONTAINER CORPORATION my target 1300

just click on the chart below triangle formation,

also watch huge volume expansion on bse and nse some one knows something ? bonus?

i dont care what the news but charts indicates explosive move on card

Posted on Friday, March 05, 2010 | Categories:

Nifty hourly chart-rising wedge will create panic

just watch rising wedge from last 2/3 days ,rising wedge indicates bed news

i expect blood bath in coming days,and nifty may slide up to 4900 levels too

while updating this nifty trading at 5085,major hurdle 5150

Posted on Friday, March 05, 2010 | Categories:

LATEST FII CALL FROM TEA SECTOR MCLEOD RUSSALE

from last 72 hours we were writing About TEA SECTOR and write too on this web site that we have given Tea stock to all FII CALLS CLIENTS.

 
our subscribers of FII CALLS buy MCLEOD RUSSALE at 224 today book 50% profit at 237 and still looks hot will kiss 245/250 soon
Posted on Friday, March 05, 2010 | Categories:

RELIANCE INFRA-catch on the opening bell

This was Our Btst Call To Our Paid members 

Catch Reliance Infra On the Opening Bell Your Stop Loss 1010
will kiss 1040/1046 in intra day.


watch the triangle on weekly chart,yes you need 3rd eye to watch the triangle(from 1400 to 950)


Impulsive Wave will take to 1125->1238->1382->1458 but you need patience for above target 


Posted on Friday, March 05, 2010 | Categories: