Indian & World
Stock Markets Update & Status As On 7 July 2018
The Indian stock markets continued to remain sideways, during the week
ended on 7 July 2018. The lack of sell off helped the new listings like RITES,
FINE ORGANIC and VARROC to give 5-20% gains.
The global markets
also remained sideways with erratic up and down moves of 1-2% on up and down
both sides. One can argue that has been the behaviour of the market since last
2 months at least.

The lack of trend on either side across the financial markets had been
due to the international and domestic factors like that of change in RBI stance
regarding interest rates, USA central bank rate hike, Donald Tump implementing
his tariff threats over China, China retaliation measures and further counter
action threats, the upcoming 2019 Loksabha election in Indian and the toughness
faced by the incumbent PM Narendra Modi. As far as the ‘uncertainty sell off’
is concerned, we have been witnessing it for almost last 5-6 months, which has
digested; at least the initial panic orinigated by them factors.
Amid all these and the sideways or what we call a languishing market;
the Chinese mainland market has corrected below 3000 mark which it was trying
to hold on since many years. The present bear market which has been persisting
since almost last 6 months, which had its roots in Trump Tariff Tantrum; is
expected to continue in the second half of the calendar year 2018 as well. It
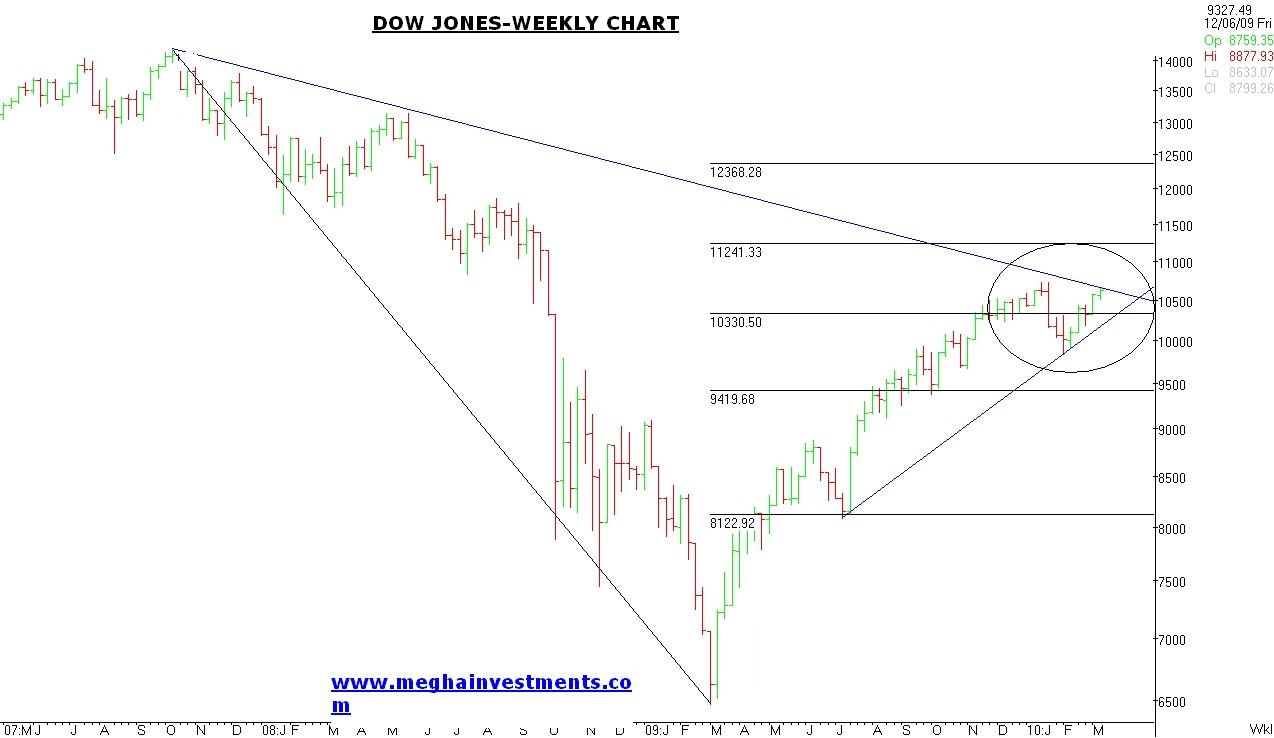
is however noticeworthy and a sigh of relief for the investors that the Dow
Jones (benchmark index of USA stock markets) has maintained its critical 200
DMA thrice after that. However, the other important indicators still signs
towards vulnerabilities in the technical chart set up. Our research suggests
that any strong upmove is not going to happen in near term in this global trend
setting equity indice and this 9th year since bull market began is
going to be a year of profit booking and uncertainty which is likely to be
followed by the global counter parts, be it the developed ones of the EMs like
India. We also believe that the present non-stop
upmove rally in USA markets is due to mainly factors such as 1). The very low
base of 2008 crash 2). The liquidity flood post USA financial crisis provided
by the developed central banks 3). The improving macro economic data in USA and
Europe 4). The election of Trump government which promised and implementing as
well upon its corporate tax cuts, and ‘america first’ economic agendas.
We believe that the rally is taking a breather this year. The stocks rally
in Europe could be backed by its own strength of macro and micro economic
indicators. While the Asian economies, as usual and as always, continue to
remain non-trending and non-decisive in whole global ball game of equity
markets and vulnerable as they were to foreign funds flow, of which India has
seen as much as USD 1 billion and USD 6
billion in debt markets, the highest in first half of any years in a decade.
This clearly says something about the world markets changing trends and global
investors’ changing portfolio settings.
We, however believed that there has to be a small cap and mid cap as
well as large cap stock technical bounce back rally, of which some already
started in last week trade. We believe this should be taken as an opportunity
for longer term investors to invest in cement, entertainment, oil gas, real
estate and some select stocks as they are available at cheap valuations.
Indian economy is just
coming out of two huge economic disruptive events of note ban and GST while the
LTCG also impacted and continue to impact the investments fraternity’s decision
making esp.the FPI ones.
We think that the Indian markets would continue to languish around the
present life time highs of NIFTY 11000 and SENSEX 36500 during the time until Mr.
Modi is likely re-elected as PM. We have seen many jokes doing rounds in social
networking that NIFTY is at 10800 but the portfolio of investors looks like
NFTY of 8000. This has happened due to the sell off in mid cap and small caps
while few large caps like HDFC, RIL, Maruti etc. continued to drive the
benchmark indices up or at least maintained it near the life highs. So, this
irony would continue to remain, and that is why we always suggest the lay investors
to take advice of professional experienced investment advisory for their
ventures into stock investing and trading.
The given views are
subject to change d
epending on changing market and global economic conditions. Become member to benefit from market and individual stock moves.
epending on changing market and global economic conditions. Become member to benefit from market and individual stock moves.
For
best services for traders and investors in Indian stock market for multibagger
stock calls and intraday stock, nifty, stock futures, options trading calls
visit our website www.meghacapital.in


