FUNDAMENTAL STOCK VIEW:
TATA MOTORS LTD.
View: Stock seems fully priced.
Recommendation:
Book profits or avoid new investments.
About Company:
Tata Motors is India's largest commercial vehicle manufacturer.
It acquired the CV division of South Korean auto major Daewoo in 2004.
The Company bought ownership of iconic car brands ‘Jaguar’ and ‘Land Rover’ from the Ford Motor Co in 2008.
The Company launched world’s low cost car “nano” in 2009.
The Company has planned a huge capex of Rs 120 bn between 2007 and 2012 for capacity expansion, introduction of new projects, product up gradation and enhancing engineering and research capabilities, which will be funded through a mix of internal accruals and debt.
The Co. has good market share in commercial vehicle segment, diesel segments, owner of world two luxury car brands and owner of world’s low cost car.
Let’s look at the fundamental of the company,
Debt to equity ratio is 1.1:1 which not good sign.
Return on net worth 9.9% which is below expectations.
Price to book value 3 times which is much higher for cyclical nature company like auto sector.
Company had paid interest on loan which is above 700 crores while profit after tax is Rs.1000 crores.
Commercial vehicles are cyclical in nature and car demand is largely influenced by per capita income growth over the long term. So we need to Value Company with price to cash flow indicator.
Cash Flow is the cash earned by the company that can be actually distributed to the shareholders
Due to heavy loss in the last year’s quarter the cash flow was negative for the company.
From the low of 125 in 2008 this stock has outperformed all auto major and make high of 845 and currently trading at 20 P/E multiple which is in our opinion not justify for this company.
Many will argue that company has good opportunity in truck business, diesel car business, luxury car segments and small car segments so why one should not remain invested in this company?
Company has large debt in its balance sheet and needs more money for up gradation, R&D, capacity expansion. If demand goes down or raw material prices such as steel rise then margin will be down significantly and will affect the results of the company.
Always remember our favorite investments mantra is avoid investments when margin of safety is low and other better opportunity is available in market like currently telecom sector trading at low price.
MUTUAL FUND PICK
Birla Sun Life Tax Relief '96-invest.
Recommendation:
This fund has always delivered good return to unit holders.
It’s good to have in every ones tax planning.
WEEKLY MARKET OUTLOOK:
Support at 5050/4985/4935
Resistance at 5190/5305/5350
Last week market trade in narrow range of just 76 points in nifty fu.
Our stop loss was 5150 and nifty could not close above 5150 levels.
If nifty fu closes 2 consecutive day above 5190 then it can rise to 5300 levels.
We at MEGHA INVESTMENTS AND RESEARCH always come up with flip side of the market.
We have given our view based on 4 different theories.
HEAD AND SHOULDERS,
Look at the chart, index is forming major reversal pattern
“Head and shoulders”
Left shoulder top is at 5168 and strong bottom of 4531(Dubai fall bottom)
Head top is 5303-strong rebound from Dubai bottom
Now we if fail to cross the high of head which is placed at 5303 and start falling then it may create right shoulders
So the height of the pattern is 800 point (4531-5303)
Confirmation of the pattern will come by two ways,
-nifty fu should not cross 5303 which is head high
-nifty need to break 4600 mark, which is neckline of the pattern
If both happen then we conclude the successful pattern and big correction is possible up to 3900 levels.
GANN WHEEL,
If you are following the w.d.gann charting then around 5150 it is best opportunity to short nifty with stop loss above 5303(above the high of head and shoulders head) with possible correction up to 4750 levels.
Image not for any use.
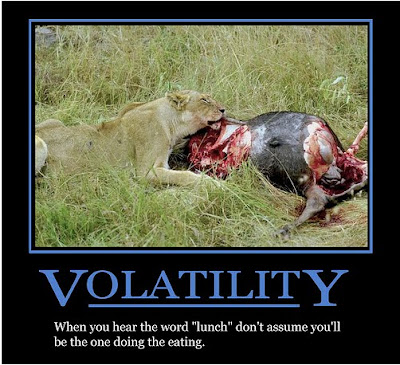
VOLATILITY INDEX
This index is less referred by retail traders and investors.
In simple and common wording it shows next 30 days volatility of particular index.
But it also shows the “greed and fear” among the investor and traders.
When the VIX trading at low which indicates no one is buying put option –every one is bullish on market.
When VIX is trading at high which indicates no one is buying call options-every one is bearish on market.
Traders and investors can take benefit of the same and can initiate trades against the trend.
In our case nifty fu VIX is trading at lowest levels since inception!
So one can go short against the bullish trend!
TIME SERIES,
From 1980 it has been history that first quarter of the every 2 year gives major turning to market either on up side or down side if we assume sensex has made high of 17790 then this pull back will not substation anymore.
CONCLUSION,
Traders with high risk capacity can sell nifty fu with stop loss of 2 consecutive closes above 5190.
MOMENTUM TRADING CALLS:
Balarmpur chini mills-
Buy above 97 with stop loss of 92 and targets of 103/105/107.
Hindustan Unilever-
Buy above 227 with stop loss of 218 and target 234.
Reliance ind-
Buy above 1055 with stop loss of 1025 and target of 1100.
ALERT- We expect profit booking in m&m fin, ambuja cements, abb, shriram transport, lanco infra and thermax. So avoid long position in above stocks.
NEWS TO WATH FOR THE NEXT WEEK:
On 15 the March two important announcements,
(1) Advance tax figures.
(2) Monthly inflation figures


